Most weather apps give you a rain percentage and stop there.
But “70% chance of rain” does not tell you whether that rain comes with lightning, damaging wind gusts, hail, or just a quiet steady drizzle.
The ingredients that turn rain into a thunderstorm, atmospheric instability, wind shear, updraft strength, moisture, simulated radar reflectivity, and electrical activity, are already tracked by modern weather models. The problem is that most consumer weather products do not surface those ingredients in a simple, readable way.
That is why OrbitalFusion created the Thunder Index: a 0-100 storm signal that answers the question people actually ask:
“Is it going to storm?”
The Thunder Index is not a rain chance. A score of 62 does not mean there is a 62% chance of storms. It means the atmosphere is strongly loaded with thunderstorm-supporting ingredients.
The index is part of OrbitalFusion, a proprietary blended forecast system developed by the Engineer.Guide Research and Development Lab for active city forecast pages on Orbital Overview.
It blends real storm physics from short-range forecast guidance with extended-range pattern guidance in a way that stays more honest about what can and cannot be known at each lead time.
The result is a readable storm signal that helps users understand whether the forecast supports ordinary rain, scattered thunder, organized storms, or severe weather potential.
Why the Thunder Index exists
Weather apps are good at showing icons. They are not always good at explaining risk.
A lightning bolt icon five or seven days away can look confident, but no model can precisely resolve a neighborhood thunderstorm that far in advance. Thunderstorms are small, fast-changing, and heavily dependent on local boundaries, instability, moisture, lift, and timing.
The Thunder Index was built around a simple philosophy:
Show what is actually knowable at each forecast range.
That means the index has two modes.
Mode 1: Near-Term Signal, hours 0-48
The near-term Thunder Index uses short-range, high-resolution convection-allowing guidance.
This is the range where the model can begin to resolve individual storm structure. At this distance, OrbitalFusion can use real thunderstorm ingredients, including instability, wind shear, reflectivity, lightning signal, updraft helicity, updraft strength, moisture, precipitation rate, and gust potential.
When the score is labeled Near-Term Signal, it means the index is looking at actual storm-supporting ingredients.
Mode 2: Extended Signal, days 3-10
Past the short-range window, OrbitalFusion switches to a more honest approach.
Instead of pretending to know whether a thunderstorm will hit a specific neighborhood six or eight days away, the Thunder Index uses broader pattern guidance.
At this range, the index focuses on whether the large-scale environment supports storms.
That includes convective precipitation, total precipitation, atmospheric moisture, cloud cover, and wind support.
When the score is labeled Extended Signal, it means the pattern supports storminess, but it should not be read as a precise thunderstorm prediction.
The near-term calculation
The near-term Thunder Index is built from nine ingredients. Each ingredient is normalized to a 0-1 scale across a meteorologically meaningful range, then weighted into a final 0-100 score.
| Ingredient | Weight | What it measures | Scoring range |
|---|---|---|---|
| Instability, CAPE | 18% | Fuel for storms and upward acceleration | 250-2,500 J/kg |
| Wind shear, 0-6 km | 15% | Storm organization and severe storm support | 10-35 m/s |
| Reflectivity | 15% | Simulated radar-like precipitation echoes | 35-60 dBZ |
| Lightning signal | 12% | The model’s explicit lightning threat field | model index |
| Rotation, updraft helicity | 12% | Spinning updraft and supercell support | 25-150 m²/s² |
| Lift, max updraft velocity | 10% | Strength of rising air inside storms | 10-55 mph |
| Moisture, precipitable water | 8% | Total atmospheric water available | 25-55 mm |
| Precipitation rate | 6% | How hard it is actually raining | 0.05-1 in/hr |
| Wind gusts | 4% | Surface gust potential | 20-60 mph |
But two refinements make the score much more useful.
Refinement 1: CIN suppression
CIN, or convective inhibition, is the atmospheric “cap.”
A day can have huge instability, but if the cap is too strong, storms may never form. Without CIN suppression, a storm index could overreact to CAPE and show a high score even when the atmosphere cannot actually release that energy.
The Thunder Index handles this by multiplying down the instability term when inhibition is strong. This keeps capped environments from falsely appearing as high storm threats.
That matters because false alarms are one of the fastest ways to make people ignore weather tools.
Refinement 2: The ingredient gate
Thunder requires actual storm evidence.
Wind and rain alone are not enough.
If instability, lightning signal, and strong reflectivity are all near zero, the Thunder Index caps the score at 25. That prevents a windy, rainy, non-electrical system from being mislabeled as a thunderstorm risk.
A cold rain, coastal storm, or windy frontal passage may be impactful, but it is not automatically a thunderstorm. The index is designed to know the difference.
The extended calculation
The extended Thunder Index uses a different ingredient set because the forecast problem is different.
At days 3-10, the goal is not to identify individual thunderstorms. The goal is to identify whether the broad pattern supports convective weather.
| Ingredient | Weight | Why it matters at long range |
|---|---|---|
| Convective precipitation | 30% | Direct model signal for convection-supported rainfall |
| Total precipitation | 22% | Overall wet pattern |
| Column moisture | 20% | Water available to fuel storms |
| Cloud cover | 14% | Active weather pattern indicator |
| Wind support | 14% | Energy and movement in the pattern |
The score stays on the same 0-100 scale, but it is always labeled as Extended Signal so the user knows this is pattern guidance, not storm detection.
Thunder Index labels
| Score | Label |
|---|---|
| 80-100 | Severe Storm Signal |
| 60-79 | Strong Storm Risk |
| 40-59 | Thunderstorm Possible |
| 20-39 | Low Storm Signal |
| 0-19 | Minimal Storm Signal |
Every score also carries a confidence tag.
| Confidence tag | Meaning |
|---|---|
| High-confidence storm signal | Full ingredient set is available, including CAPE, CIN, radar-like fields, and lightning or rotation support |
| Blended storm signal | Some ingredients are available, but the full signal is incomplete |
| Early guidance signal | Pattern-only guidance, usually at longer forecast ranges |
What a high Thunder Index actually means
This is the part that matters most for real users.
The Thunder Index is not just a number. It describes the kind of weather the atmosphere is capable of producing.
40-59: Thunderstorm Possible
At this level, the ingredients overlap, but they are not extreme.
This usually means scattered thunderstorms are possible. Users should expect rumbles of thunder, brief downpours, occasional cloud-to-ground lightning, and short-lived storms.
Many storms in this range are pulse storms. They build quickly, rain hard for 20-40 minutes, and then collapse.
Outdoor plans need a backup, but most of the day may still be usable.
60-79: Strong Storm Risk
At this level, the ingredients are more robust together.
This is where storms stop being background weather and start becoming events.
A Strong Storm Risk signal may support:
- Frequent lightning
- Rapid storm growth
- Damaging wind gust potential
- Hail potential
- Stronger and longer-lived storm cells
- More organized storm clusters or lines
The key difference is storm organization. When instability and wind shear overlap, storms can become stronger, last longer, and travel farther.
This is the range where users should pay closer attention to hourly timing, radar, and local alerts.
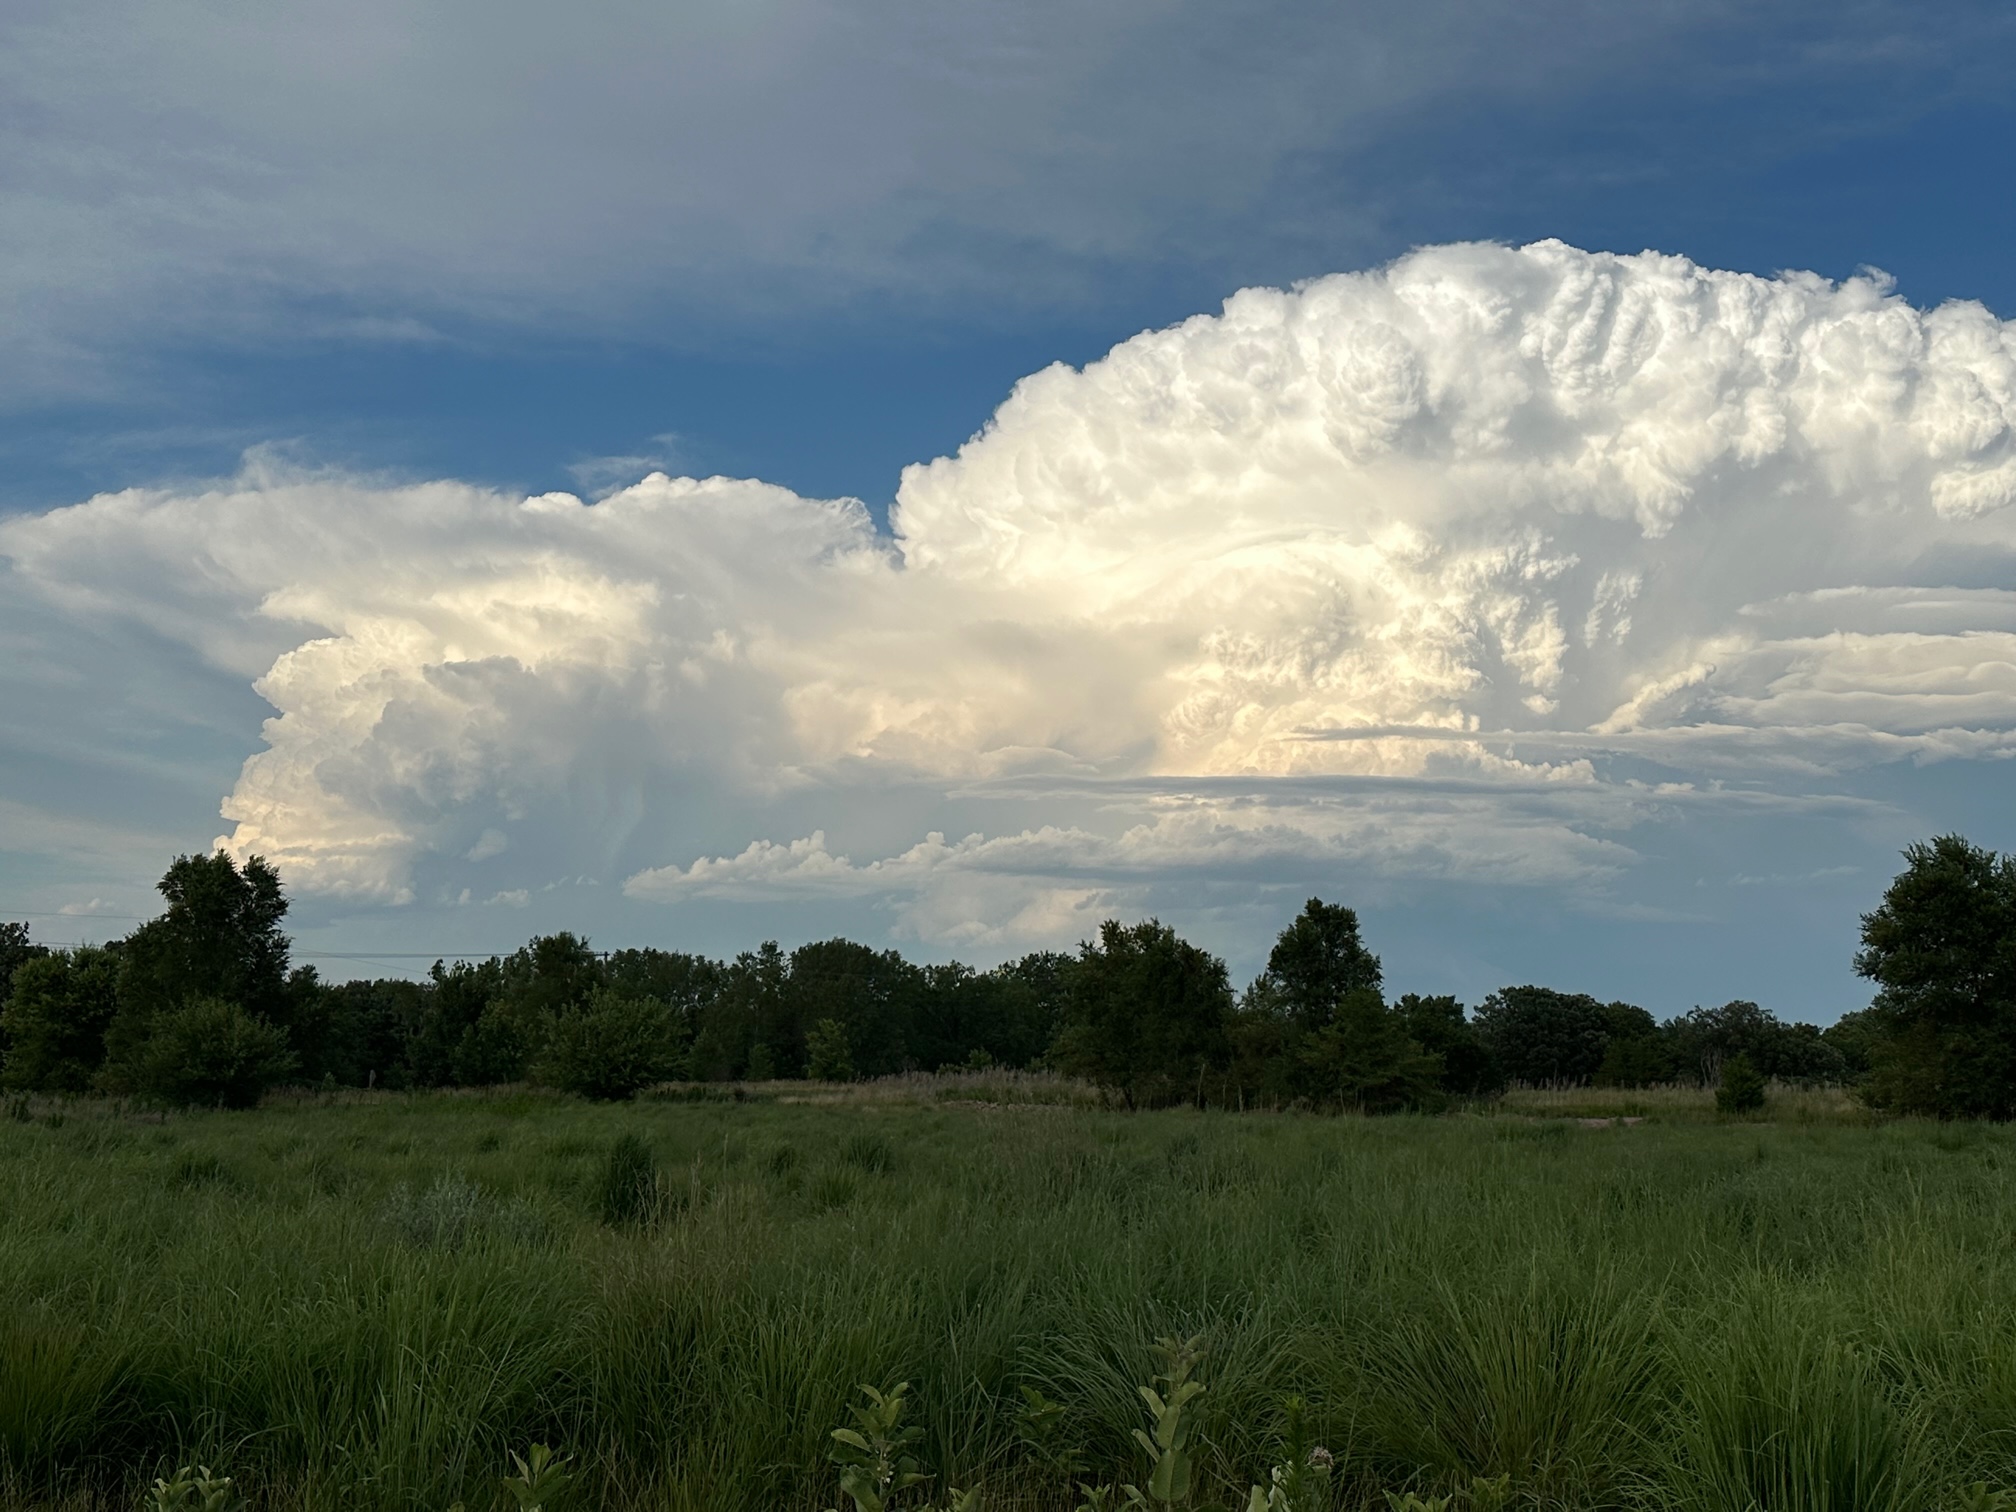
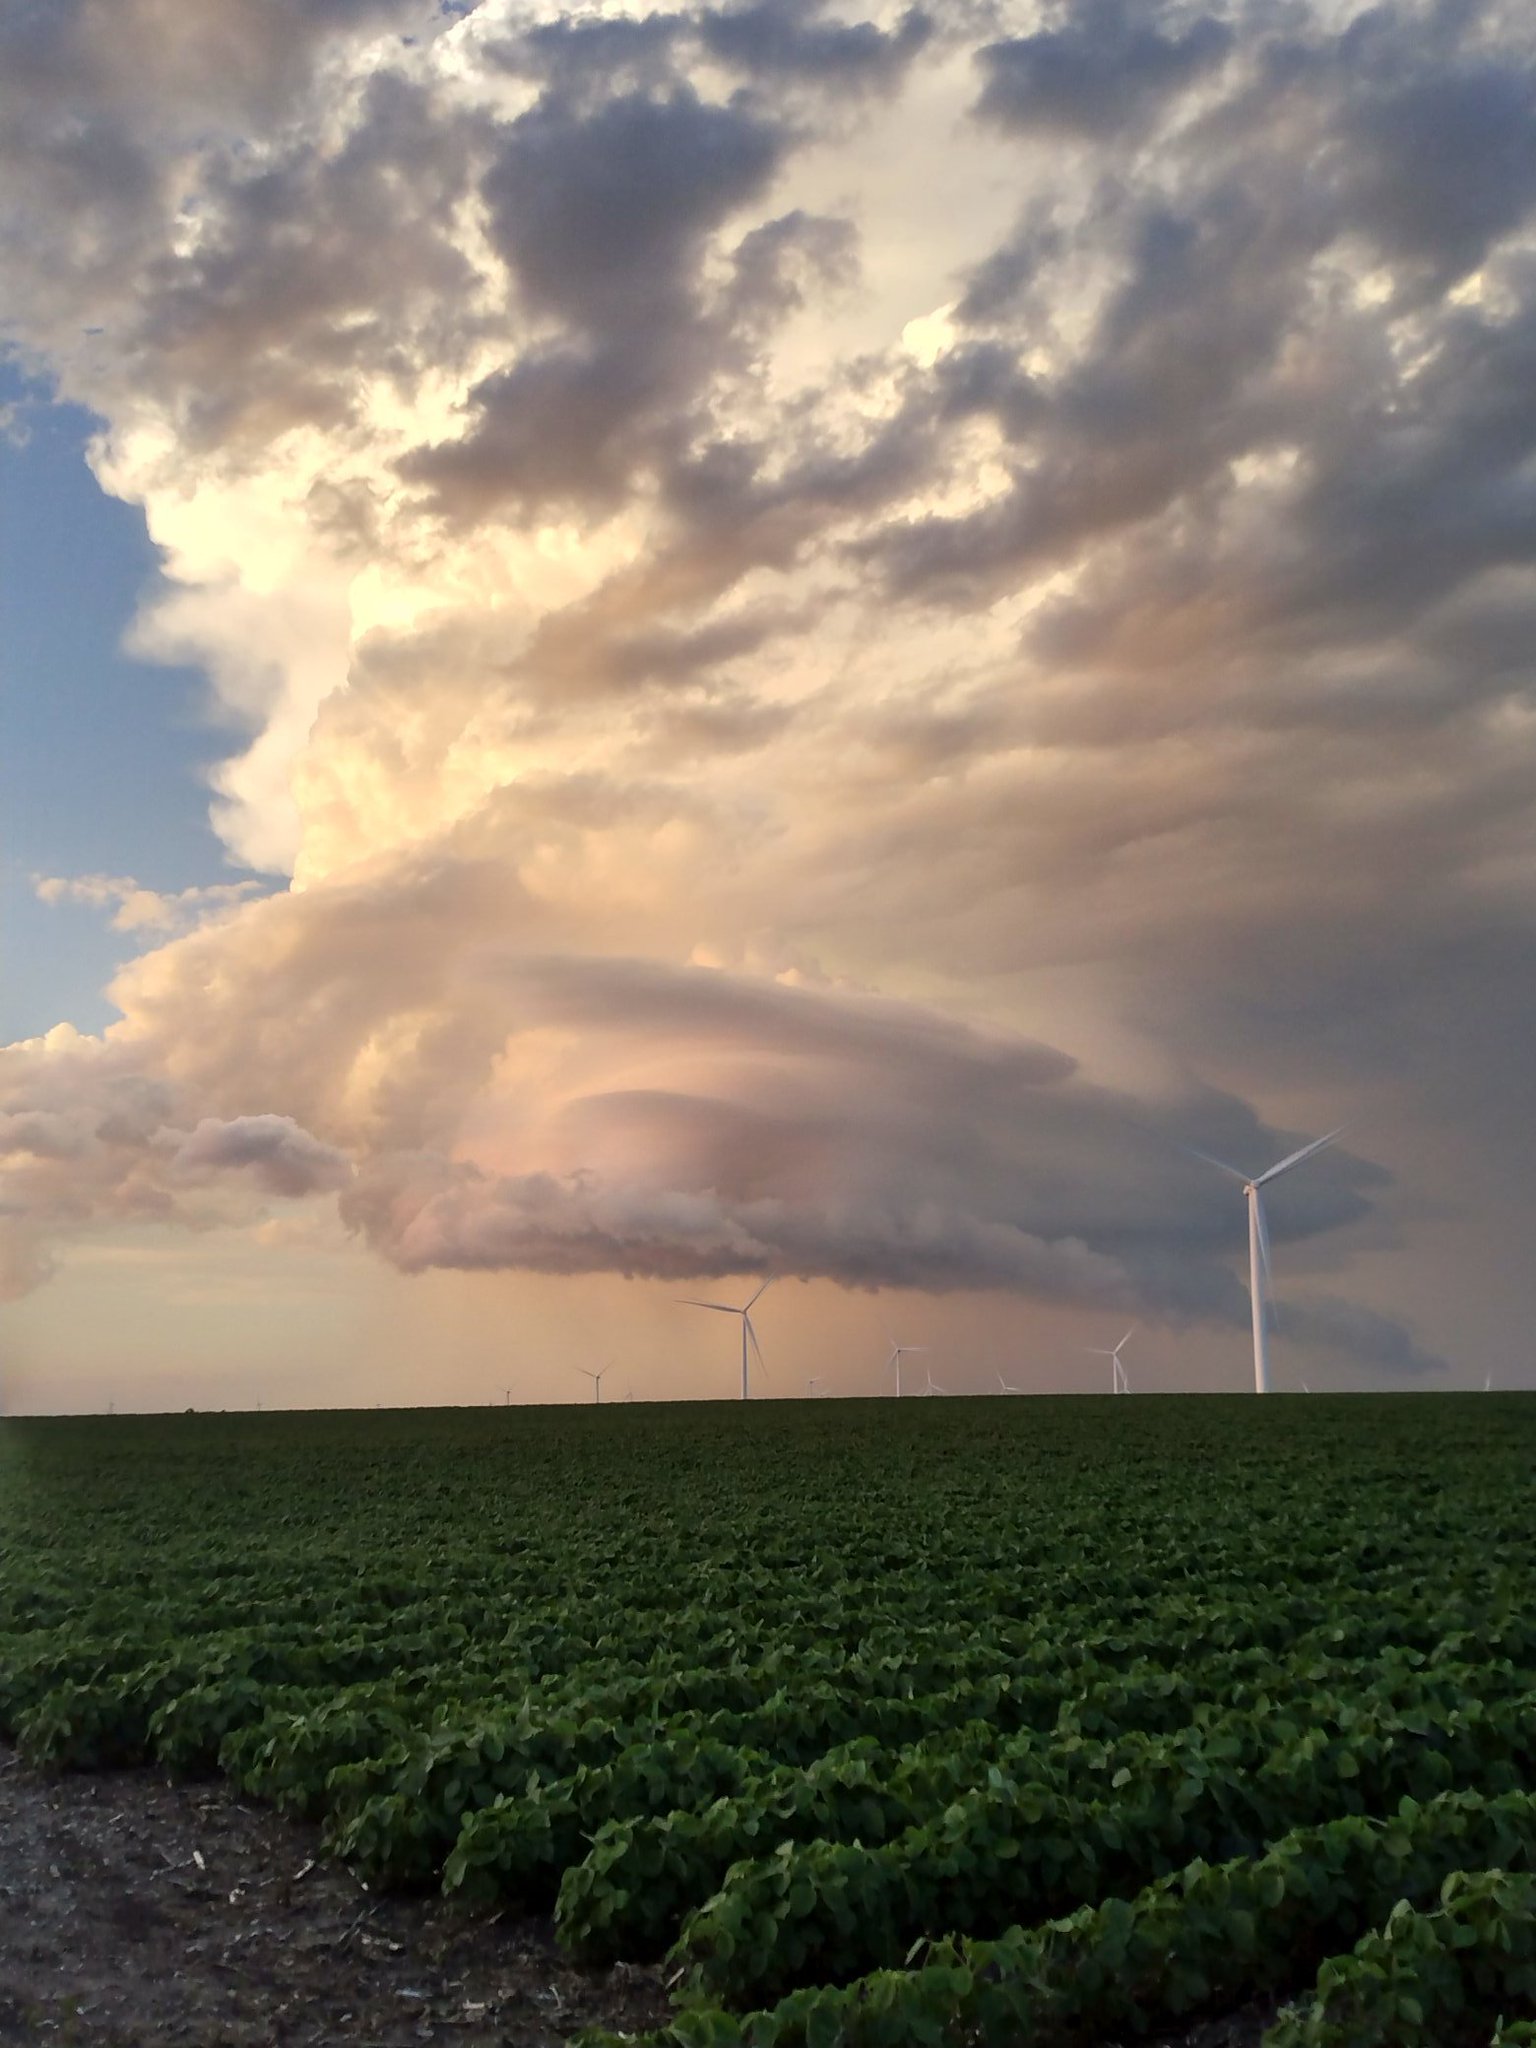
80-100: Severe Storm Signal
This is the highest tier.
At this level, the atmosphere is strongly loaded, and the signal may include rotation, stronger updrafts, high reflectivity, deep moisture, organized wind support, and lightning potential.
This is supercell and squall-line territory.
A Severe Storm Signal can indicate support for:
- Very frequent lightning
- Explosive thunderstorm development
- Damaging straight-line winds
- Large hail potential
- Rotating updrafts
- Flash-flood-rate rainfall
- Fast changes in sky conditions
At this level, the page should push users toward hourly timing, radar, warnings, and official safety information.
The Thunder Index is designed to describe the signal, not replace official alerts. For life-safety decisions, users should always follow local National Weather Service warnings and guidance from official emergency sources.
Why this is different from a rain percentage
A rain chance answers a narrow question:
“Will measurable precipitation occur?”
The Thunder Index answers a different question:
“Does the atmosphere support thunderstorm behavior?”
That difference matters.
A rainy day can have a high precipitation chance and a low Thunder Index. That could mean steady rain, drizzle, or a stable frontal system.
Another day might have a lower rain chance but a higher Thunder Index. That could mean not everyone gets rain, but any storm that forms could become intense.
That is why the index is a signal, not a probability.
The honest forecast philosophy
Three design choices define the Thunder Index.
1. The index can say “no”
The ingredient gate helps prevent false alarms. If the atmosphere does not show meaningful thunderstorm evidence, the score stays low.
2. Forecast range is respected
Near-term scores use storm ingredients. Extended scores use pattern support.
The product does not pretend that day-8 lightning precision exists.
3. Confidence is shown
If the input data is incomplete, the confidence tag says so.
That gives users a better understanding of how much trust to place in the number.
How often the index updates
The Thunder Index recomputes automatically every few hours for each supported city. As new forecast runs become available, OrbitalFusion refreshes the score so the page reflects the latest available guidance.
This gives each city page a fresh, physics-backed storm signal without pretending that weather is more certain than it really is.
Final thought
The Thunder Index exists because people do not just want to know whether it might rain.
They want to know whether the sky is loaded.
They want to know whether the weather could interrupt a game, cancel an outdoor plan, produce dangerous lightning, knock down limbs, or develop into something severe.
That is the purpose of the Thunder Index:
A simple storm signal built from real atmospheric ingredients, honest forecast range, and transparent confidence.
For more technical context, see the OrbitalFusion Thunder Index specification in THUNDER_INDEX.md.
Disclaimer: The Thunder Index is a storm signal, not an official alert product, and it does not replace National Weather Service watches, warnings, or emergency alerts. For safety decisions, follow official National Weather Service forecasts and local emergency guidance.